SPECTRA Screenshots
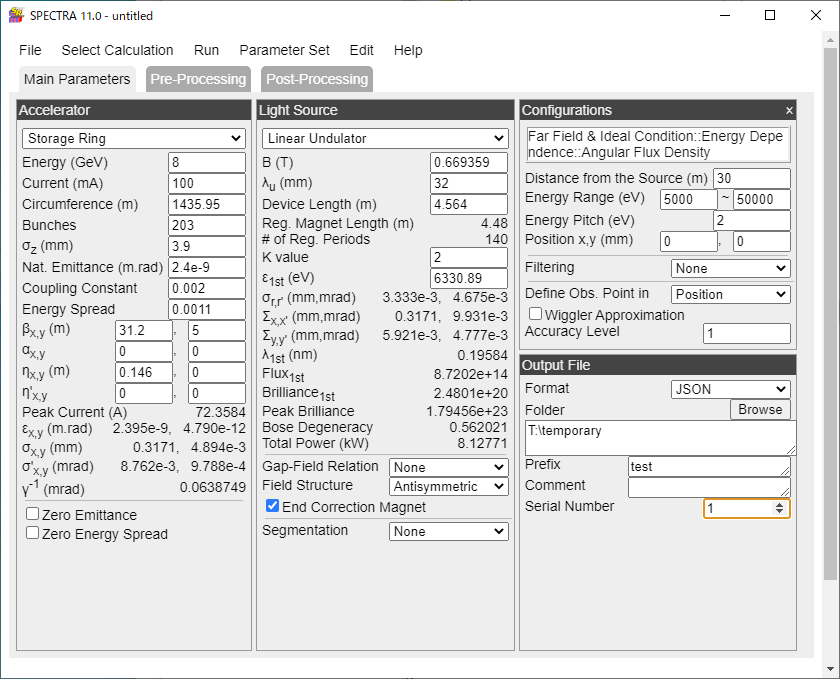
Main GUI Window
Main GUI to configure the parameters and options necessary for calculation.
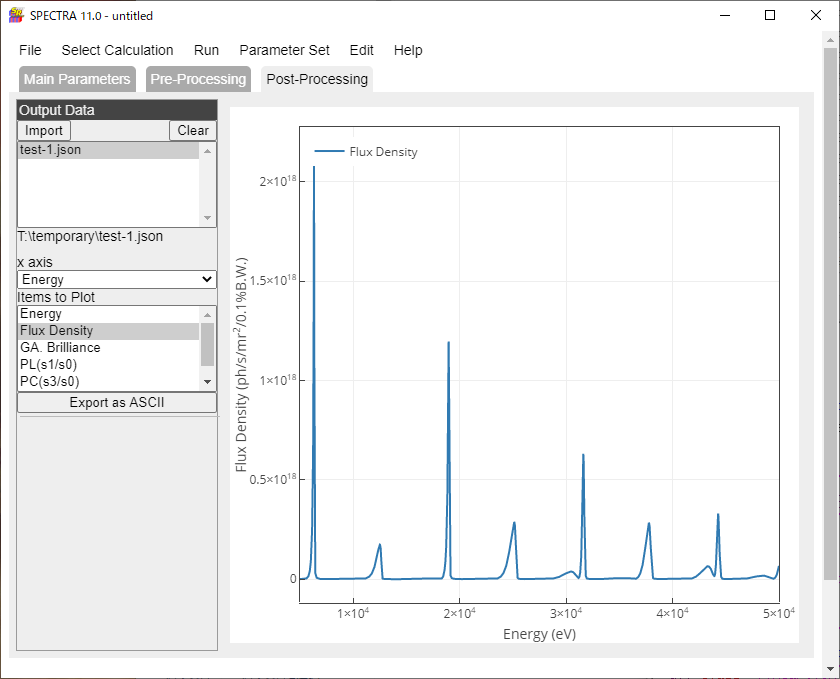
Post-Processor
Post-processing GUI to visualize the calculation results. Many options to edit the graphical plot are available.
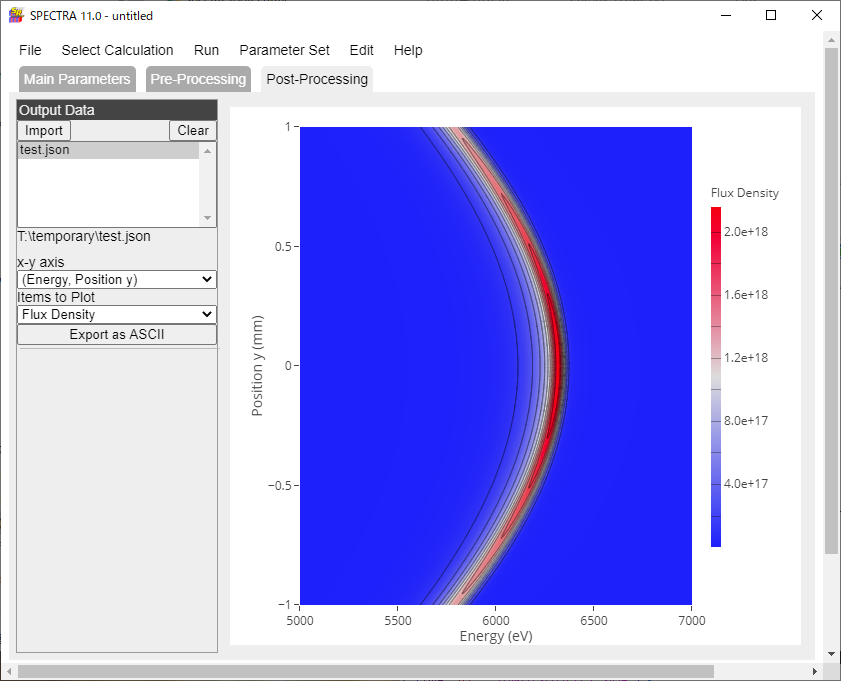
Scanning results can be also visualized: example of spectral variation when scanning the vertical observation postion.
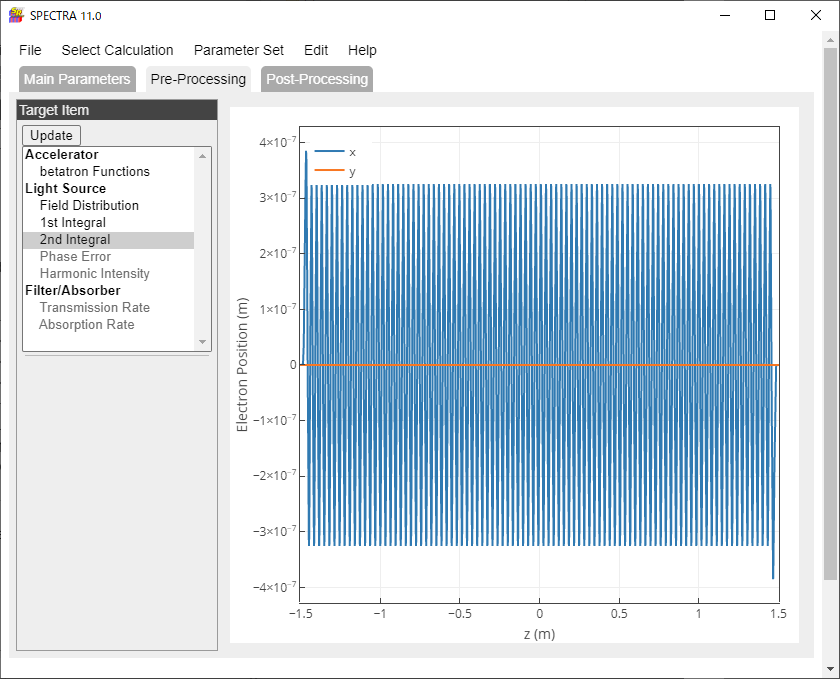
Pre-Processor
Pre-processing GUI to visualize a number of pre-processed data. Example: electron trajectory in an undulator.