Overview of simplex-ui
The python package simplex-ui is to operate the FEL simulation code SIMPLEX from the python script.
How it works?
To save the effort of the software development as much as possible, simplex-ui takes advantage of the resource for the desktop version; the diagram shown below explains how simplex-ui works as a python script.
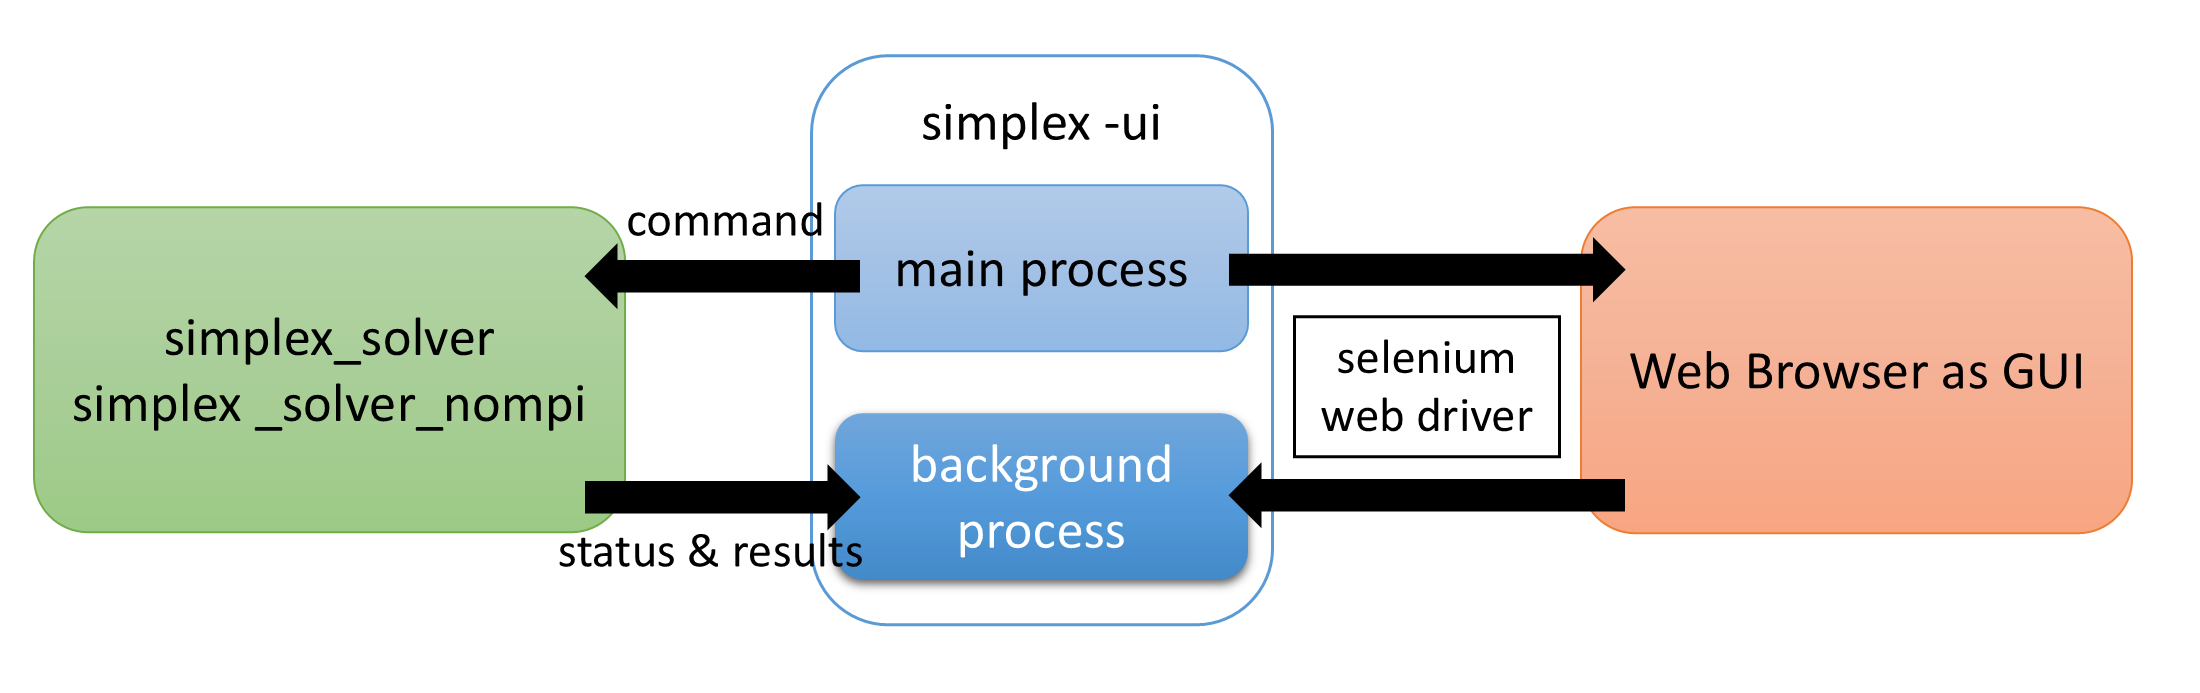
Diagram of how simplex-ui communicates with other software components.
As a GUI, simplex-ui opens the remote repository for the source file with a web browser and communicates with it through Selenium WebDriver, a well-known framework to automate the operation in the web brwoser. When necessary, simplex-ui invokes the solver (simplex_solver or simplex_solver_nompi) as a child process and communicates with it (sends a command or receives the status of progress). Upon completion of the child process, simplex-ui loads the result and sends it to the browser to be plotted in the Pre-Processing or Post-Processing tabbled panel. In case the user is offline, the source files, which are downloaded and stored in the local repository when simplex-ui is installed, can be used instead. Refer to Launch Options about how to enable this option.
Installation
simplex-ui is available from the Python Package Index (PyPI), and thus can be installed by a standard pip command,
pip install simplex-ui [--user]
or
pip3 install simplex-ui [--user]
on some platforms.
The [–user] option may be needed when global installation is not allowed. Note that binary packages are available for Windows and Mac OS platforms, but not for Linux distributions because of the too diverse versions of core libraries (glibc). Thus in Linux platforms, the source codes are downloaded and compiled during the installation process. This means that the user should arrange the enviroment for software development before installation, such as the C/C++ compiler, CMake, and MPI (optional), and the installation process may need a bit long time.
In version 3.3.0, the source code for the CLI mode (refer to Operation Modes for available operation modes) has been fully revised to use only the python standard libraries to communicate with the solver, instead of the Selenium WebDriver. As a result, several packages (selenium and wxPython) are no more needed if only the CLI mode is used and others are not; if the users do not like to install these packages, try [–no-deps] option to avoid installation of them. Note that pexpect package is still necessary, and should be installed manually in this case.
Another important revision in 3.3.0 in the CLI mode is the implementation of functions to plot the simulation results, and to show the parameters/configurations in a web-browser, without the GUI. This assists to use simplex-ui in the Jupyter environment.
Parallel Computing
simplex-ui supports parallel computing based on MPI. To enable this option, MPI library should be installed depending on the platform as follows.
Windows
Install MS-MPI; other MPI libraries are not supported.
Mac OS
Install MPICH; if you already have OpenMPI installed in your system (and prefer to continue to use it), comiplation of the source files with the OpenMPI library is needed in the installation process; this can be done by running pip command with –no-binary option as follows,
pip install --no-binary simplex-ui [--user]
which avoids the installation of binary package and tries to compile the source files with the installed MPI library.
Linux
Install MPICH or OpenMPI. The pip command tries to find the installed MPI and compile the source files accordingly.
Getting Started
The simplest way to get started with simplex-ui is to run as a module. If you have “Chrome” browser installed in your environment, try,
python -m simplex
or,
python3 -m simplex
to launch simplex-ui as a GUI mode, in which most of the functions available in the desktop version are supported.
If you prefer another browser, add an option (for example -e for Edge) to specify it. Refer to Launch Options for details of how to launch simplex-ui using a preferred browser. Note that “Chrome” (or “Edge”) is recommended because of several issues encountered in other brwosers as summarized below.
Browser |
Remarks/Issues |
|---|---|
Chrome |
Fully tested and most recommended. |
Edge |
Recommended as well as Chrome. |
Firefox |
Loading source files from the local repository may fail. The user is requested to specify a directory to put the source files when simplex-ui is launched for the first time. |
Safari |
GUI cannot be operated, or it is not editable because frozen by the OS; it just shows the parameters and configurations, and plots the pre- and post-processed results. |
Operation Modes
There are three operation modes in simplex-ui: GUI, CLI, and interactive ones. To enable each operation mode, refer to the instruction of the function Start().
GUI mode
The GUI mode mimics the desktop version, and all the operations are done in the GUI (web browser). This mode has been prepared as an alternative to the desktop version in Linux distributions.
Interactive mode
The interactive mode has both of the capabilities available in the GUI and CLI modes. Namely, it can be operated through the GUI (web browser) and receives commands from the python script. Note that several menu commands (File-Exit, Run-Start Calculation, etc.) are disabled in the GUI; this is to avoid an unintended conflict between commands from the GUI and CLI.
CLI mode
The CLI (command line interface, or CUI = console user interface) mode is dedicated to the utilization of SPECTRA for a batch job. It communicates with the solvers through the python standard libraries, and the GUI is not shown. Note that visualization by the Pre- and Post-Processors have been available since 3.3.0 (plotly package needs to be installed). In addition, the parameters and configurations can be verified as an HTML document.
Tips for using the CLI in the Jupyter environment
The CLI mode is well compatible with the Jupyter (lab/notebook) environment; the input parameters and configurations can be displayed in an easy-to-read format, and the pre- and post-processing results can be plotted in various manners. Both of them are shown in an output cell, which helps to check the input condition and examine the output results.
Before going ahead, however, we have two issues to be addressed for using the CLI mode in the Jupyter environment. First, the plotly library, which is used in simplex-ui to generate a graphical plot, may not work in the Jupyter environment and simply output a white blank in the plot area. There are many different reasons for this issue, so the users are kindly requested to look for their solutions online. Second, the users may encounter an error message during the simulation, like “IOPub message/data rate exceeded.” This is not really an error in the simplex solver, but coming from an upper limit of the data/message transfer rate within the Jupyter environment. To solve this issue, one idea is to launch Jupyter with “–NotebookApp.iopub_data_rate_limit” and/or “–NotebookApp.iopub_msg_rate_limit” options. For details, refer to information about this issue found online.
Launch Options
Option |
Alternative |
Contents |
|---|---|---|
–chrome |
-c |
Specify Chrome (default) as the browser for GUI. |
–edge |
-e |
Specify Edge as the browser for GUI. |
–firefox |
-f |
Specify Firefox as the browser for GUI. |
–remote |
-r |
Use remote repository for the source file. |
–local |
-l |
Use local repository (/path-to-python/site-packages/simplex/src/indx.html) for the source file. |